
After several months of encouraging—if lucky—reliability, stability has given way to wobbliness around the national aviation system. And in a coincidence only Agnes Callard could be rooting for, this sudden destabilization figures to coincide with the busiest air travel day of the summer: the TSA expects to screen 2.82 million travelers on Friday, which would surpass the pandemic recovery highwater mark set just earlier this month.
The primary culprit was a piece of energy apparently meandering around the upper atmosphere. Its slow-moving nature combined with ample moisture to antagonize New York City airports from Saturday to Tuesday; with associated convection focused across northern New Jersey, already-disadvantaged Newark (EWR) was especially snarled.
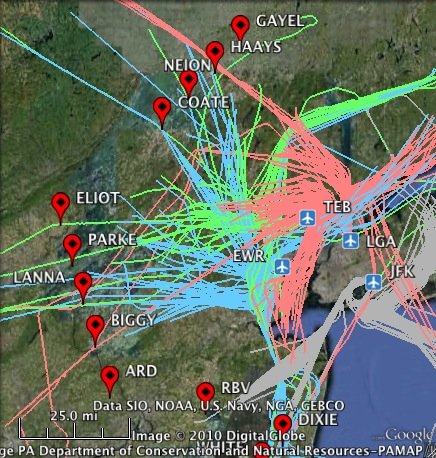
This proximity no doubt contributed to relatively more challenging conditions at the airfield, where it produced 109 mentions of thunder in EWR METARs. (Across the river, “only” 18 mentions at JFK and 12 at LGA.) But more critically, EWR relies on the airspace above northwestern NJ to a much greater extent for ingress and egress than JFK or LGA.
This unsettled weather pattern has likewise upset the tenuous relationship between the DOT-led FAA and airlines. Given that United’s New York City franchise leans heavily on EWR, CEO Scott Kirby has seemingly volunteered to command this particular skirmish for airlines.
In a nominally-internal email, Kirby told employees that the FAA had failed them; calculatedly, we’d bet, he would soften his tone towards Administration leadership a few paragraphs later. We agree with Scott’s tonal pivot: the controller shortage is years in the making and we don’t fault current FAA employees. But underneath the headline-grabbing language, he started to pull at some interesting threads.
What’s a Thunderstorm Worth in Terms of Capacity?
One should expect thunderstorms to reduce airport capacity by some amount—and there’s a lot of history to glean how much weather “should” pressure capacity. However, Scott would suggest that FAA staffing constraints depressed capacity below weather-attributable depths. For their part, the FAA hasn’t refuted this insinuation, though notably, only a pair of Sunday evening operations plans included a mention of ZNY staffing.
So let’s concede staffing contributed to even-lower rates on Sunday; there were still eye-watering ground delay programs on Saturday, Monday, and Tuesday. If staffing dragged on the capacity for the duration of this 4-day event, that seems like a more defensible hill for Scott to occupy.
Absent additional mentions of ZNY staffing, we think our modeling can help to detangle non-weather influences. To wit, we prefer to aim our forecasts at the future, but occasionally they can help to contextualize past performance. And importantly, since our last product update, we’ve evolved from point estimates to probabilistic predictions. So what does that look like?
Let’s consider the first hour of the Tuesday GDP as an example (i.e. 13:00L, or 1 p.m. ET, on the 27th). In the final forecast we’d make for the hour, we’d predicted capacity would be 35.3 aircraft per hour: this is our best estimate of what capacity “should” have been when controlling for the weather (and runway status—all of which were open during the times in question). But historical capacity data is noisy and, even when we make our final forecast at T minus one hour, there’s still some weather uncertainty.
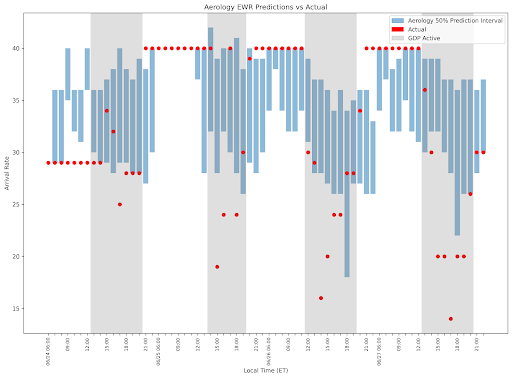
For that reason, we want to focus not on our point estimate of capacity, but the range of possible capacity outcomes. To this end, we’ve visualized something like a tropical storm’s cone of uncertainty for each hour. We’d expect approximately 50% of actual values to fall within the blue bar, while the remaining 50% of values would be split evenly above and below the bar. For that 1 p.m. hour on Tuesday, when accounting for weather and runway status, we put chances at approximately 50% that the actual value would fall between 30 and 39. (While not visualized, our point estimate would generally fall toward the middle of this bar.) We’ve also charted the actual, recorded arrival rate with a red dot (36, in the case of 1 p.m. on Tue).
You can think of each hour as the roll of a four-sided die, where:
- rolling a one yields low-end, below-our-uncertainty-bar capacity for that hour,
- rolling a two or three results in expected, within-our-bar capacity,
- and rolling a four returns a high-end, above-our-bar arrival rate.
For any given hour, you have a 25% chance of getting low-end capacity—hardly a remarkable event. Even across eight rolls (read: hours), you have a better than 1 in 10 chance of getting 4 or more low-end rates. We’d be reluctant to conclude there’s some influence other than weather, runway status, and noise at play in the wake of one ugly afternoon/evening. Maybe that’s why Scott qualified his remark that the reduction in rates was almost certainly a reflection of staffing constraints.
Who is Right?
But we can decrease variability by rolling the die more times, i.e. increasing sample size. We’ll set aside Sunday, when there was some self-acknowledgment of staffing constraints, and consider just the Saturday, Monday and Tuesday ground delay programs. Those three days provide a sample of 24 hours during which a GDP was active; a low-end, below-bar arrival rate was recorded 14 out of these 24 hours. If you were to roll our 4-sided die 24 times, what’s the chance that you get 14 or more low-end rates? On the order of 1 in 2,000. At those odds, we’d take a bet there’s some factor—most likely FAA staffing—influencing capacity that our model can’t see.
Could Scott (and, more recently, Joanna Geraghty from JetBlue) use this math to credibly claim that the FAA has underperformed during this event? Those would be his words, not ours. Regardless of blame-casting, these shades of capacity are material: given the compounding nature of delays (like compounding interest, but decidedly bad), delivering even one or two more aircraft per hour would seriously knock down EDCT delays.
But much like we’ve attempted to separate the hand dealt to the FAA (again, bad… like storm motion of five knots bad) from how they played it (arguably poorly), the same question should be asked of the airlines. Air traffic delays of 3 hours are an unquestionably weak hand to be dealt; even so, there should be some expectation as to how the airlines execute on those cards, however lousy.
Unfortunately, we haven’t reached the mile marker on our data science roadmap that would help to diagnose that. That said, when we’ve erected our model stack, we’d wager that a re-forecast supports a credible counter-claim from Secretary Pete.
And if I Don’t Care Who is Right but I’m Flying Over the Holiday Weekend?
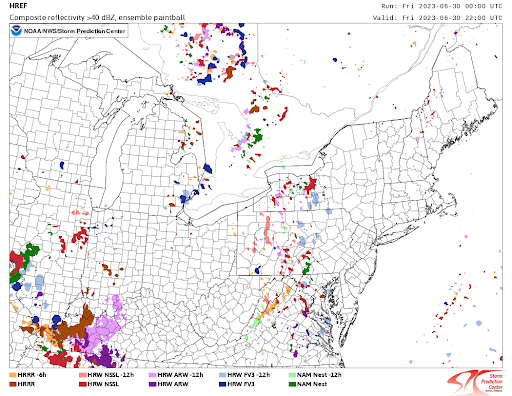
As for Friday, high pressure remains in control for the New York metro area, though another slow-moving low-pressure system lurks across the Great Lakes. This low will swing a warm front through the Ohio Valley, with thunderstorms firing ahead of this boundary. Metro terminals look to remain dry, though convection could sneak into eastern Pennsylvania late day to exert some pressure on capacity. Using that same cone of uncertainty approach—but around air traffic delays—we think the 75th percentile of hourly average delays tops out at 42 minutes (in the 7 p.m. hour).
But for travelers booked on United on Friday, they’d be advised to pay closer attention to FlightAware than the National Weather Service. United is racing to get its operation fully recovered for this key test, though if they’re successful, it will be by an uncomfortably narrow margin. After canceling approximately a quarter of their mainline operation on Tuesday and Wednesday, their Thursday cancelation settled at 18%. As of 9 a.m. ET, there are 188 cancels on the books for today, though—of all the gambles we’ve made herein—we’d be most confident betting that more cancels are forthcoming.
For one, we suspect humpty-dumpty EWR has not quite been put back together; and there’s likely some recovery taking place related to yesterday’s irregular operations at DEN as well as ORD; and DEN figures to get hit again today. It’s just a matter of whether it’s a trickle or tranches. If Friday’s cancel count grows by less than 20% from here, we’d say they held the line. Accordingly, United hoisted waivers for EWR, DEN, and ORD.
Editor’s Note: AirlineGeeks has partnered with Aerology to deliver rich data-driven insights to our readers ahead of peak travel periods.
